Create Your First Project
Start adding your projects to your portfolio. Click on "Manage Projects" to get started
E-Commerce Data Analysis
Python Script
I conducted a comprehensive data analysis project on a global e-commerce store dataset, starting with data cleaning in Excel to ensure accuracy and consistency. I then transitioned to Python for in-depth data exploration, statistical analysis, and advanced visualization.
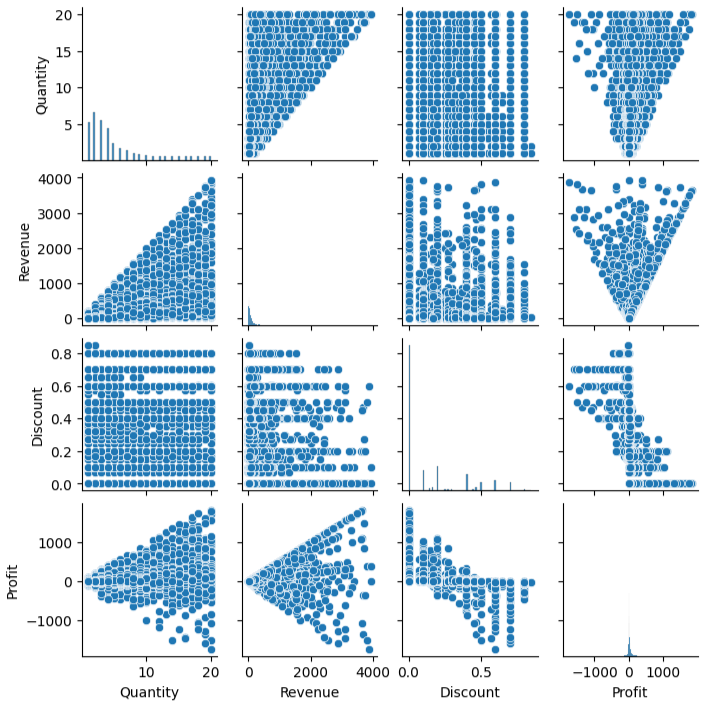
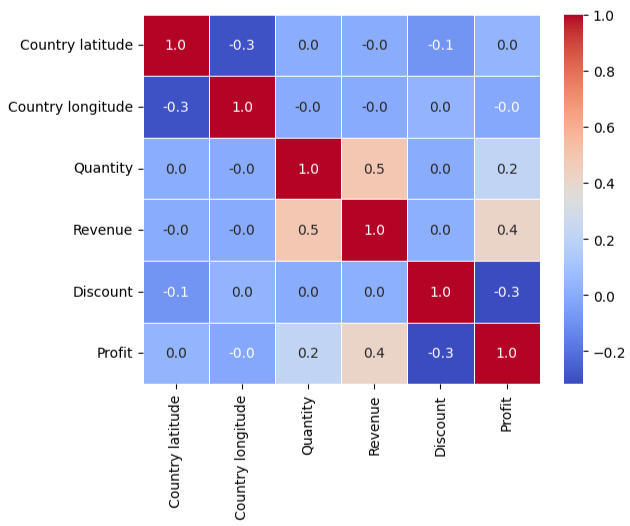
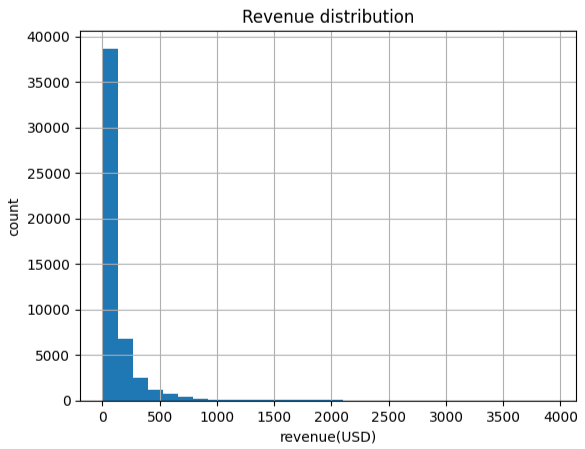
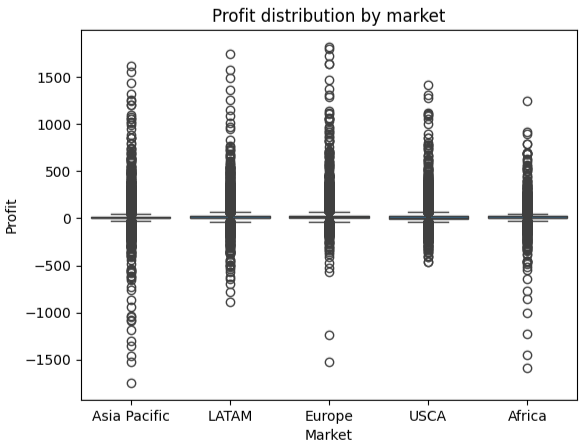
I performed statistical analysis by creating a box plot to visualize profit distribution across markets, a histogram to assess revenue distribution, a correlation heatmap to identify relationships between all variables, and a pairwise plot to explore interactions among numerical variables.
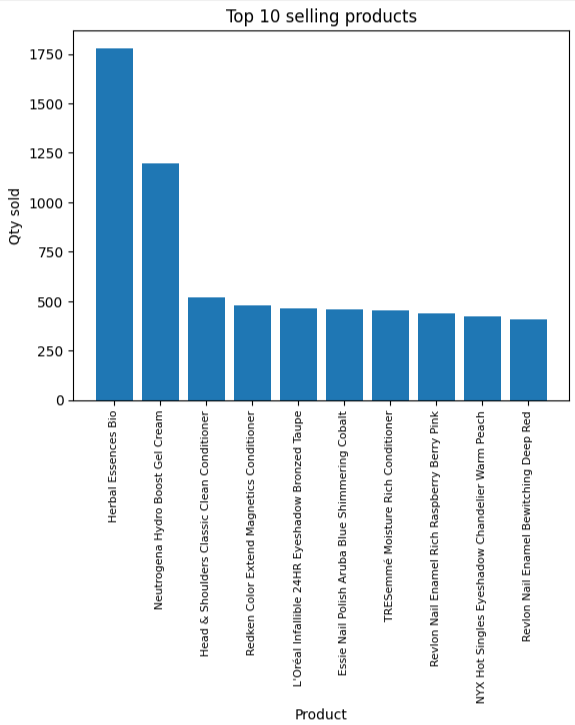
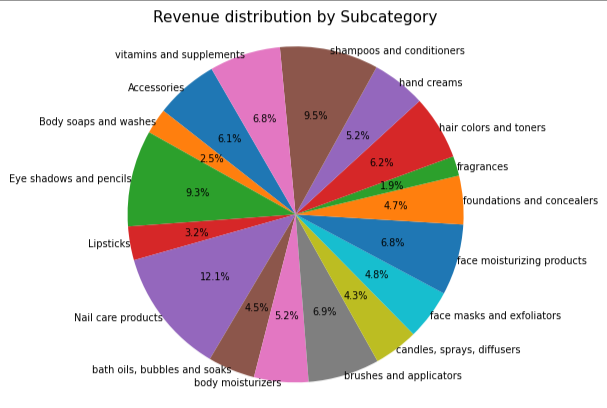
I expanded my analysis with targeted data visualizations, including a pie chart illustrating revenue distribution by subcategory, a bar chart showcasing the top 10 best-selling products, and a combination chart comparing quantity sold and revenue across categories.
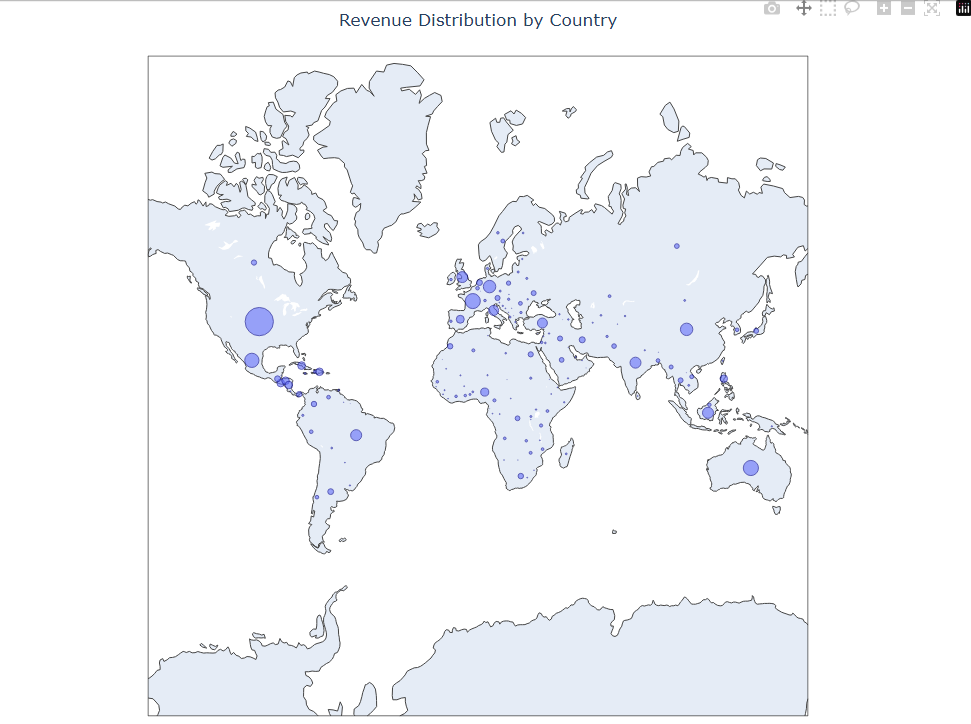
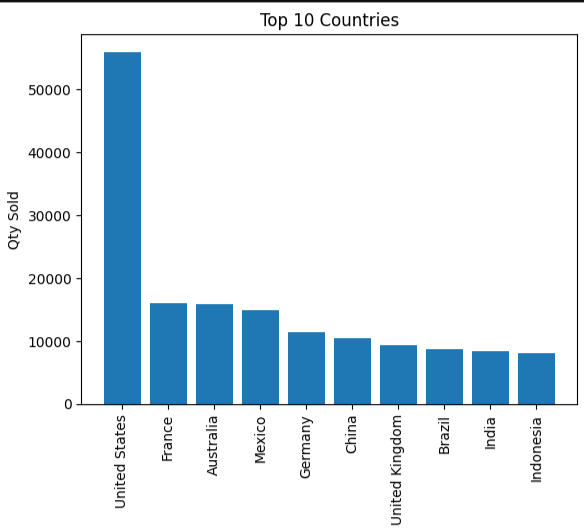
Additional visualizations included a bar chart highlighting the top 10 selling countries, a comparative profit analysis by market and global region, and an interactive bubble map depicting revenue distribution worldwide.
This analysis provided valuable insights into market performance, product demand, and revenue patterns.