top of page
Create Your First Project
Start adding your projects to your portfolio. Click on "Manage Projects" to get started
Sales Analysis Case Study
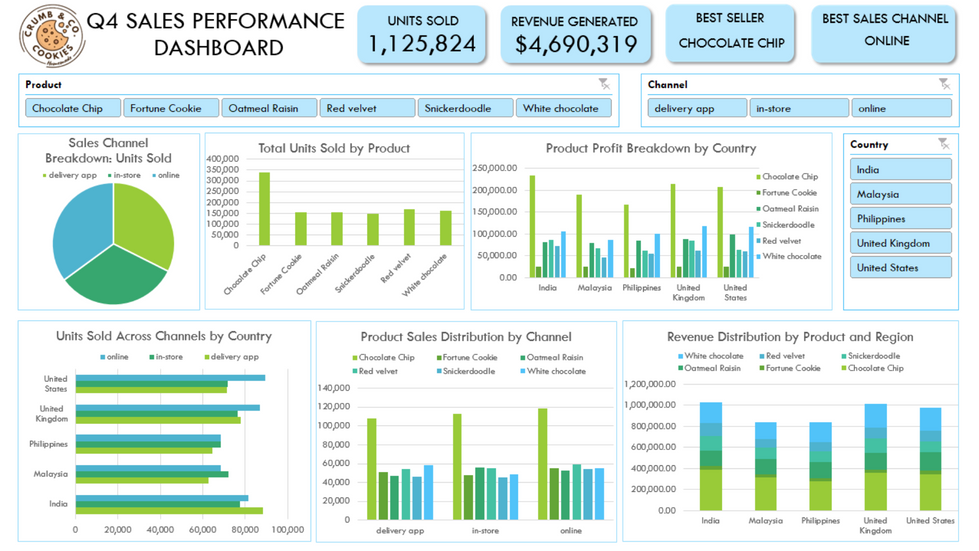
As part of my data analytics portfolio (and my love for cookies), I created a Q4 sales performance dashboard for a fictional cookie brand, Crumb & Co., using Microsoft Excel.
This project highlights my ability to:
-Analyze and structure raw sales data.
-Visualize KPIs like revenue, profit, and units sold by product, channel, and country.
-Design clean, insight-driven dashboards to support business decisions.
While Crumb & Co. is fictional, the data storytelling, layout, and insights reflect real-world business intelligence work. My goal was to turn raw data into something as satisfying as a warm cookie—clear, useful, and enjoyable to dig into.


bottom of page